Frequently Asked Questions
Find answers to common questions about B-Xtrender Tracker
What is B-Xtrender Tracker?
Where are you getting your data?
Is the B-Xtrender Indicator free?
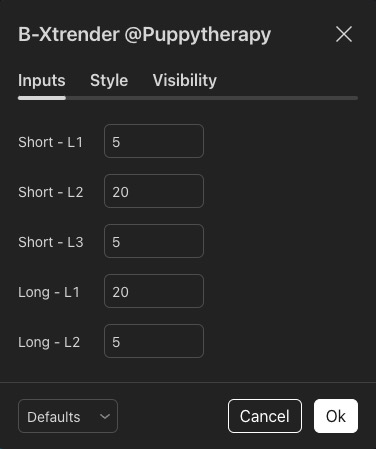
What are your settings for the B-Xtrender Indicator?
What is the Short-Term Momntum Oscillator (STMO)?
shortTermXtrender.What is the Short-Term Trend Signal (STTS)
maShortTermXtrender.What are all the STTS Patterns and what do they mean?
| Pattern | Visual | Description |
|---|---|---|
|
HH (Higher High)
|
| Occurs when the price of an asset reaches a peak that is above the previous peak. This pattern indicates an uptrend, suggesting bullish sentiment among traders. If the market continues to make higher highs, it shows strength in the upward trend. |
|
LH (Lower High)
|
| Occurs when the price peaks at a level below the last peak before it. This pattern, when combined with lower lows, confirms a downtrend. It shows that even when the price tries to recover, it does not reach as high as before, indicating weakening buying pressure. |
|
LL (Lower Low)
|
| Occurs when the price dips to a level below the previous low point. This indicates a downtrend, pointing to bearish sentiment. Lower lows suggest that sellers are in control and that the downward momentum is continuing. |
|
HL (Higher Low)
|
| Occurs when the price, after dropping, finds support at a level higher than the previous trough. Like higher highs, higher lows also suggest an ongoing uptrend. It means that pullbacks are not as deep as before, showing that buying interest is strong even during corrections |
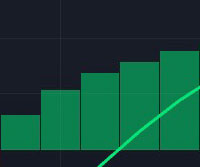
HH (Higher High)
Occurs when the price of an asset reaches a peak that is higher than the previous peak. This pattern is indicative of an uptrend or bullish market condition.
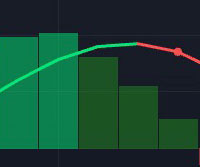
LH (Lower High)
Occurs when the price hits a peak that is lower than the previous peak. This pattern can signal a potential downtrend or at least a weakening in the current uptrend.
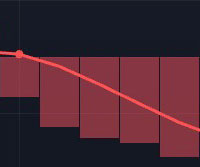
LL (Lower Low)
Occurs when the price drops to a low that is lower than the previous low. This is characteristic of a downtrend or bearish market, indicating that sellers are dominating, pushing prices to new lows.
HL (Higher Low)
Occurs when the price trough (or low point) is higher than the previous trough. This is another sign of an uptrend, showing that even during pullbacks or corrections, the support levels are rising.
Do you use the Long-Term Signals?
How accurate is the price data?
When are the daily and weekly close?
In contrast, cryptocurrency markets close daily at 19:00 EST and operate seven days a week, without interruptions for holidays, ensuring continuous 24/7 trading.